Why is Nobody Talking about Pandas NamedAgg?
It is fairly old by now, but on version 0.25, pandas introduced NamedAgg. It is mostly a convenience, it's not huge, but for me it's life changing.
View comments >>>
It is fairly old by now, but on version 0.25, pandas introduced NamedAgg. It is mostly a convenience, it's not huge, but for me it's life changing.
View comments >>>
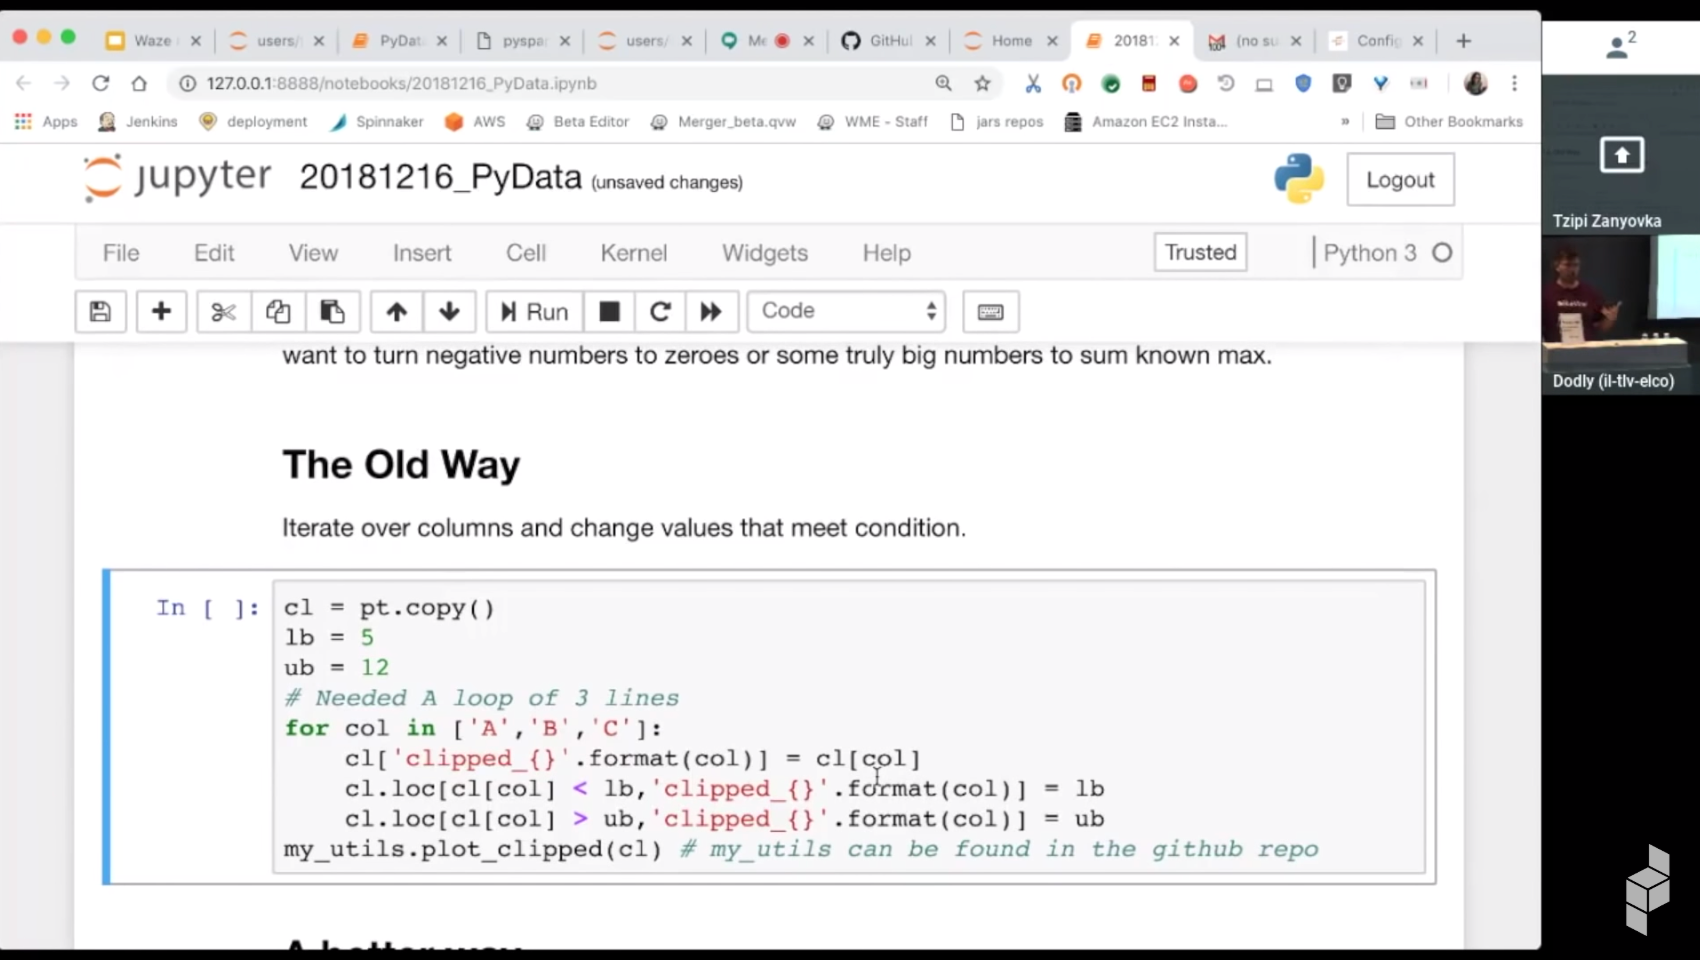
Diving Into Pandas is Faster than Reinventing it. A talk I gave at the PyData meetup based on the blog post.
View comments >>>
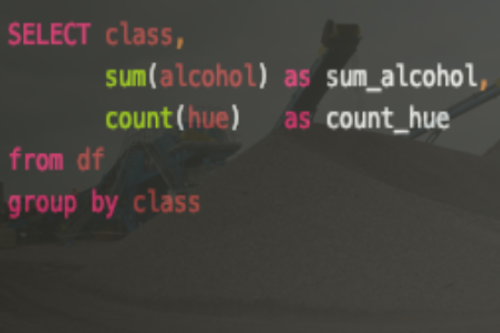
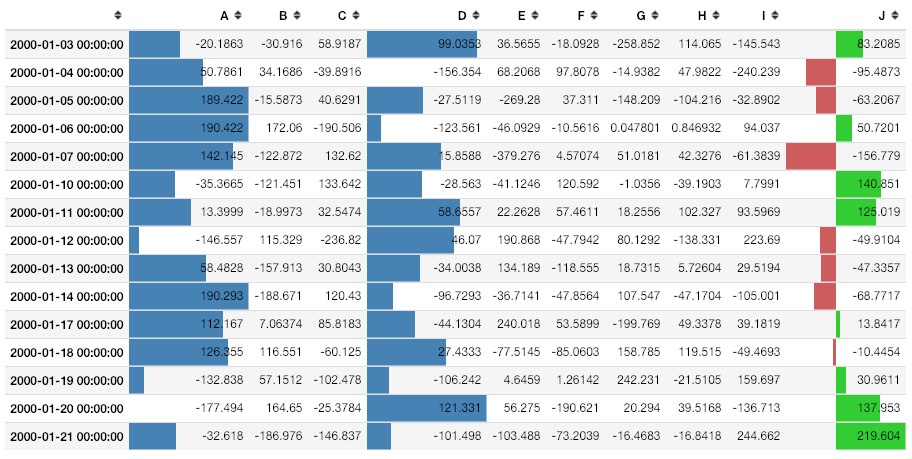
Many times, when we research, it's great to visualize the data with with colors. I'm the first one to use Matplotlib when it is needed but sometimes there is just no other way than looking at the data itself. Coloring the data could help a great deal with that.
View comments >>>
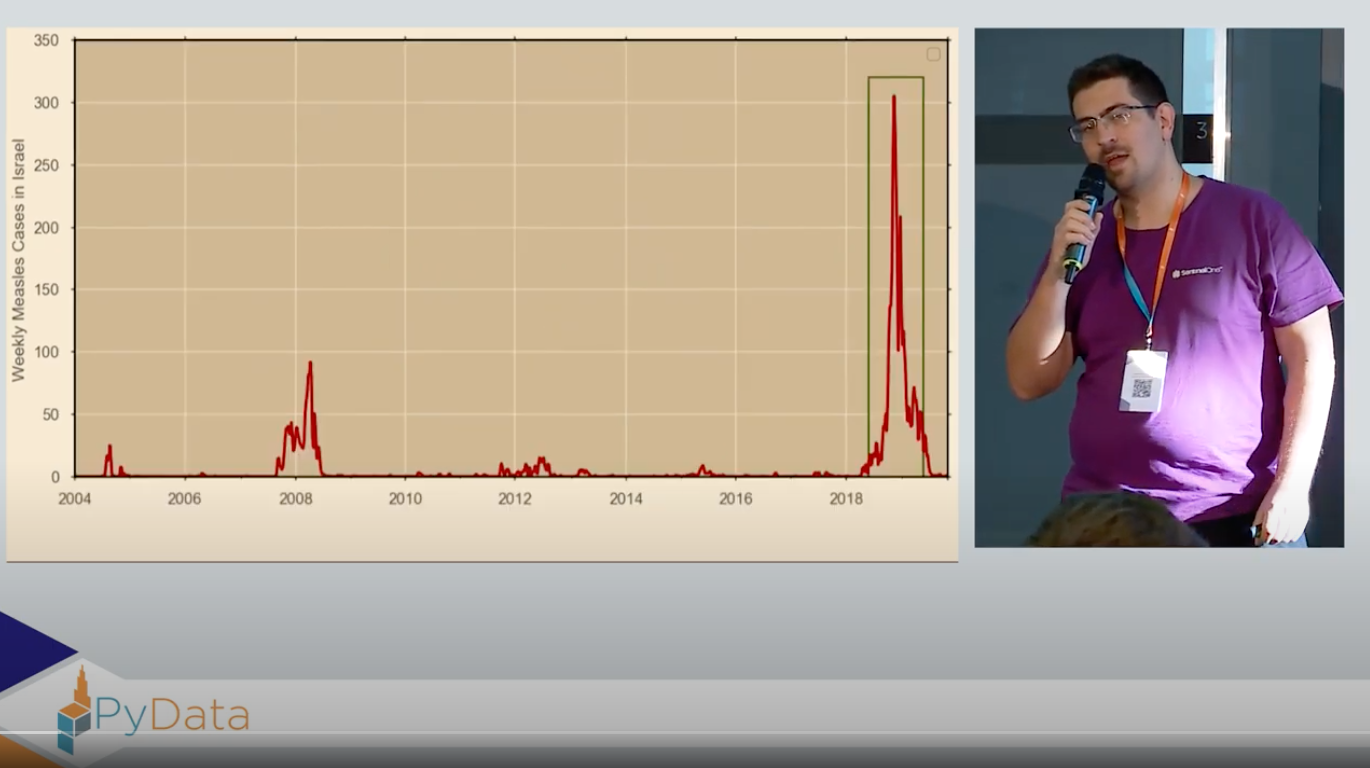
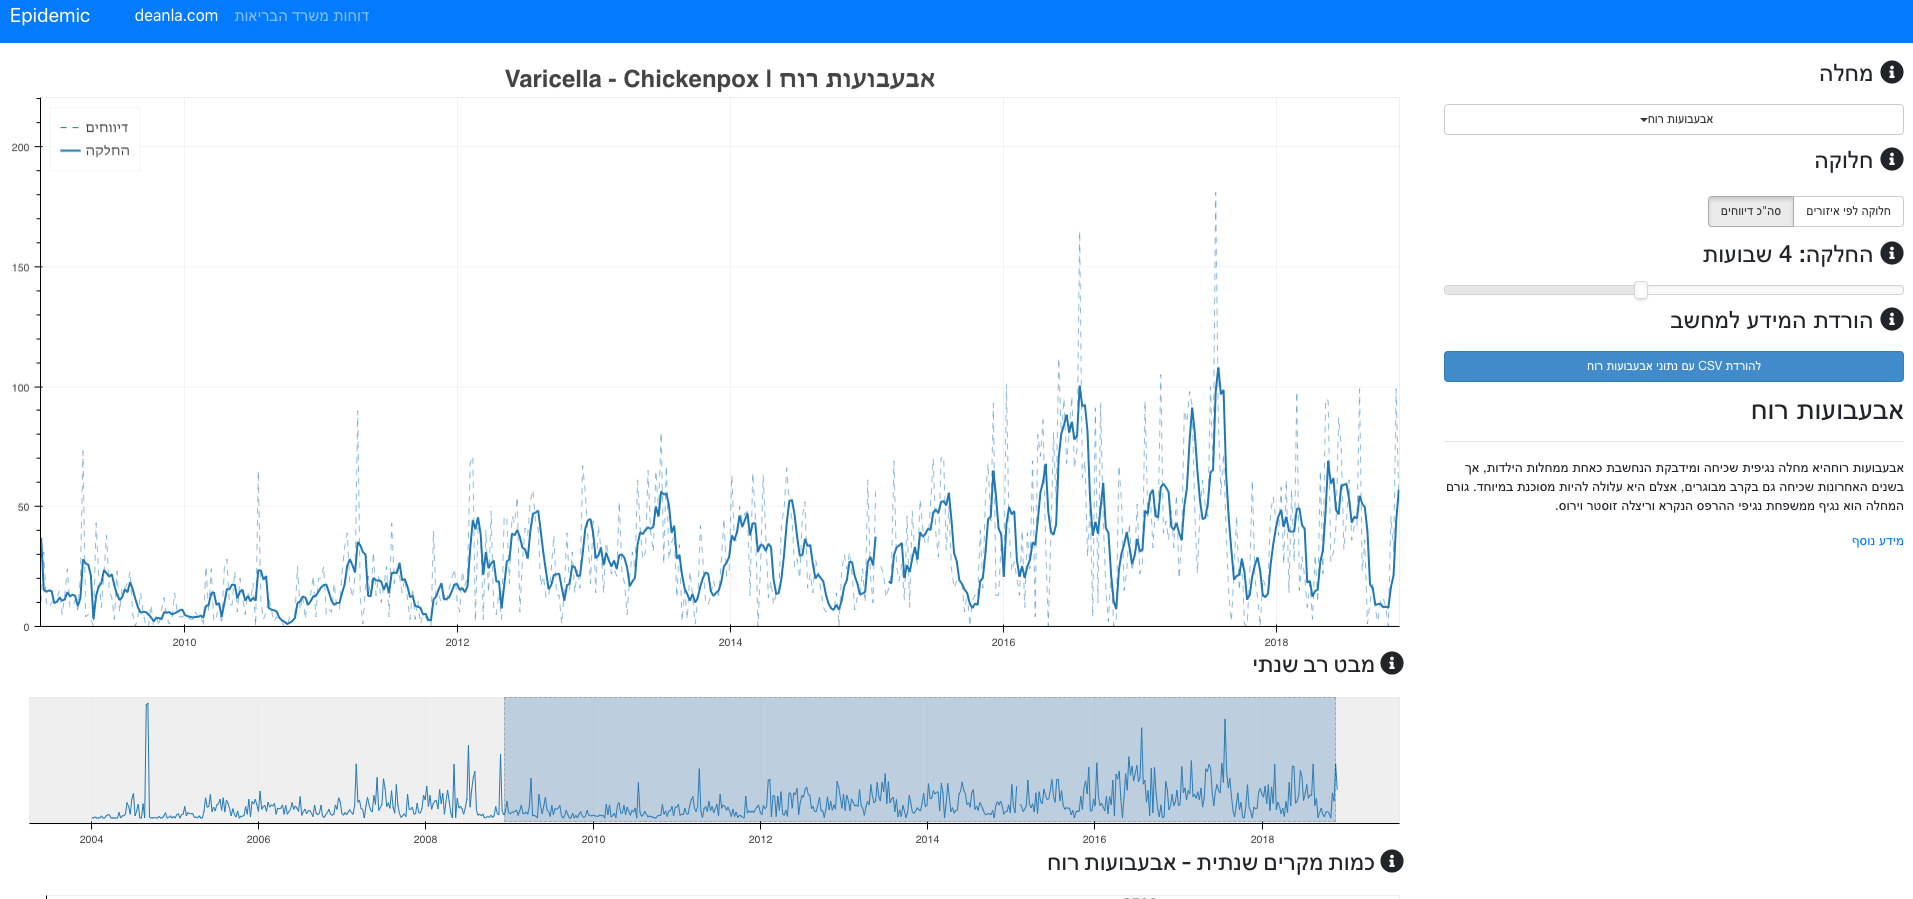
My new website Epidemic (Hebrew) is up and running.
Epidemic is an open data public health project focused on making disease data accessible to the public.
The website uses mainly Bokeh with some basic css and javascript, and has many options such as:
View comments >>>
This notebook aims to show some nice ways modern Pandas makes your life easier. It is not about efficiency. I'm pretty sure using Pandas' built-in methods will be more efficient than reinventing pandas, but the main goal is to make the code easier to read, and more important - easier to write.
View comments >>>

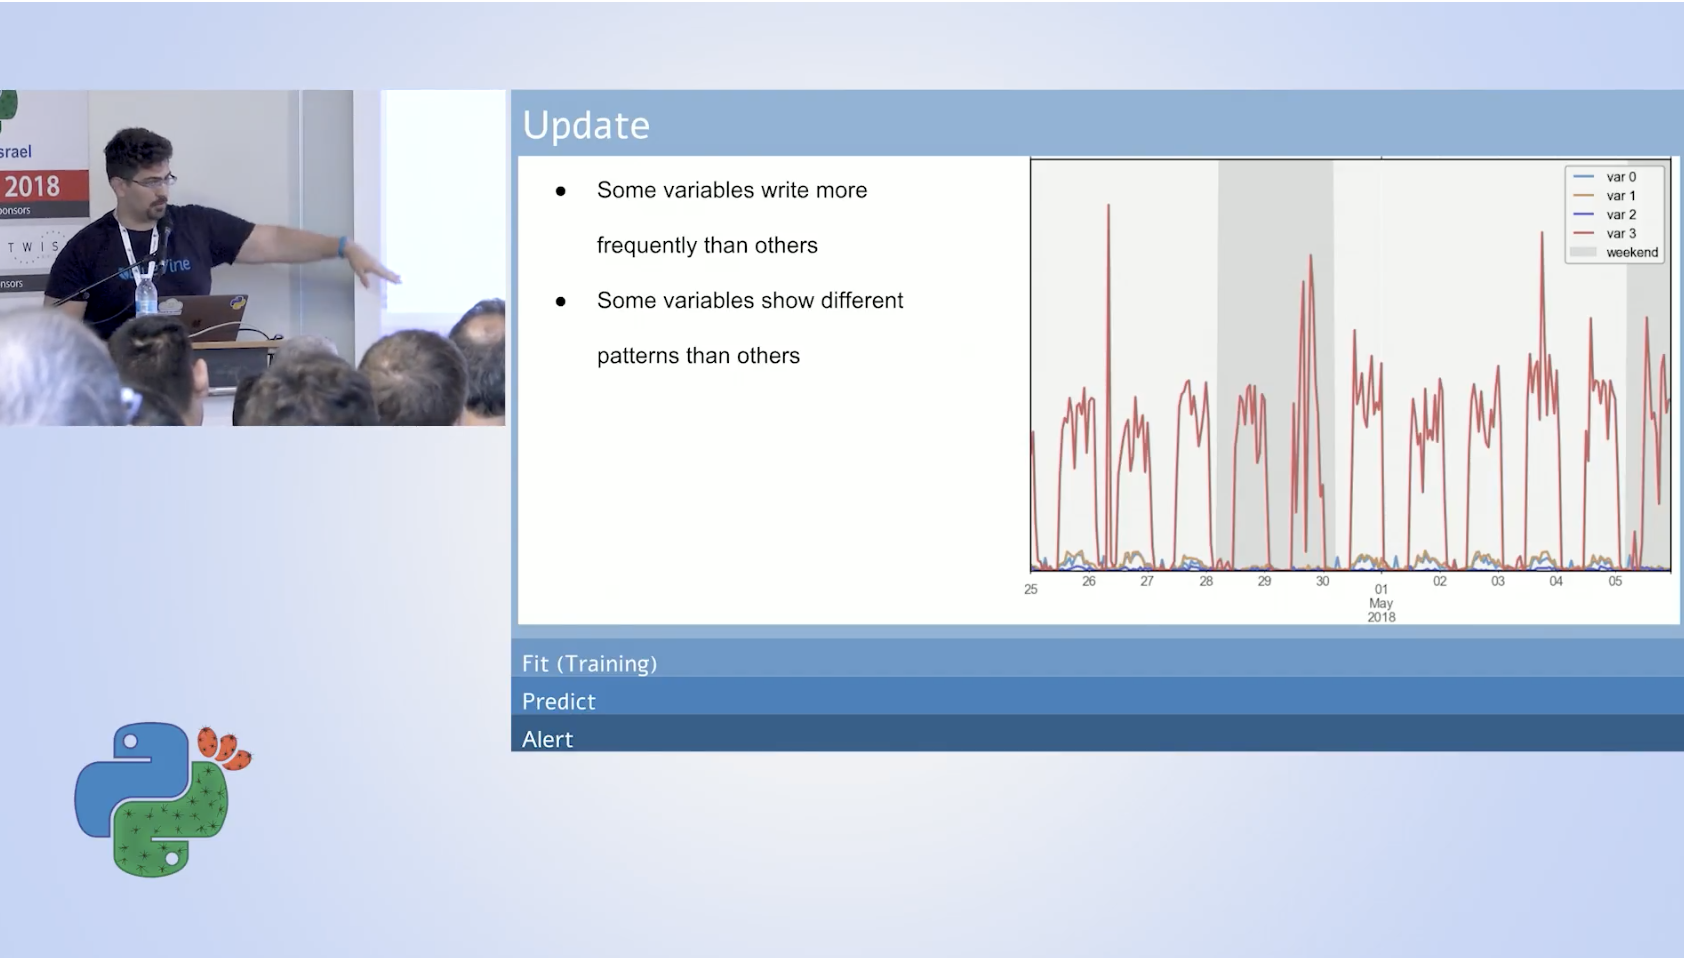
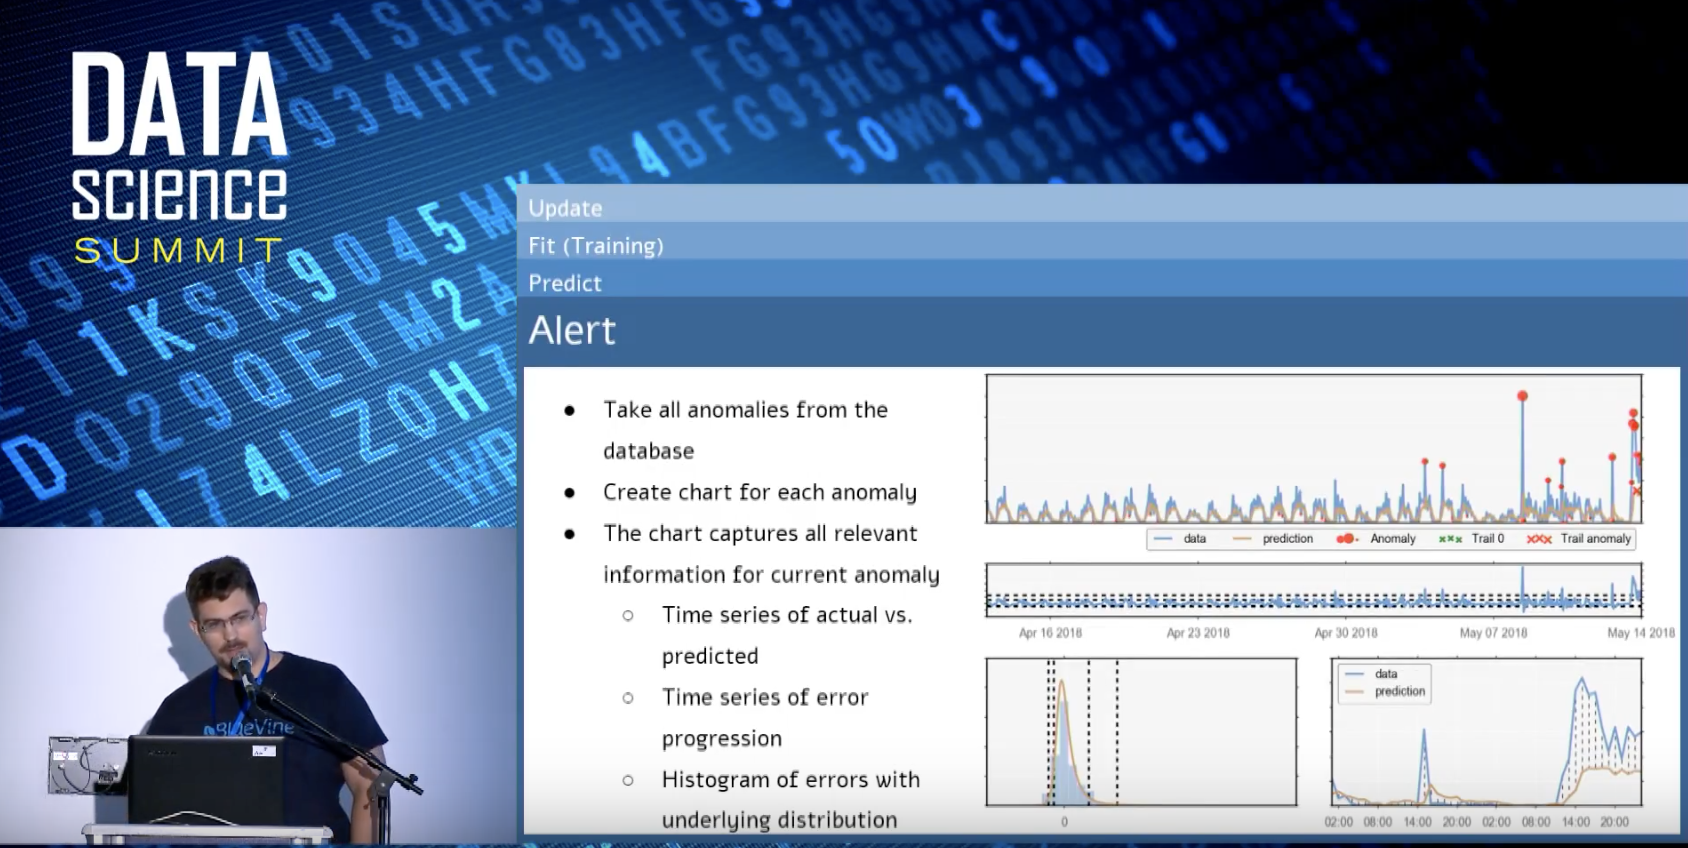
Anomaly Detection using Neural Networks, and extra Python stuff
View comments >>>
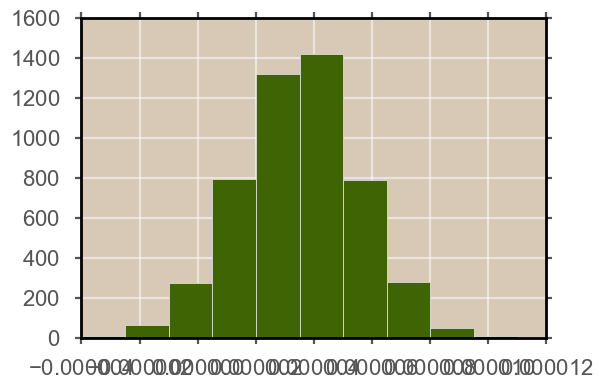
A recent issue I had in my research is tick labels that overlap each other. It happens when there are too many leading zeros before the significant digit, yet too loo little for matplotlib to intelligently shift to scientific notation (about 4-7 leading zeroes). That result in the tick labels …
View comments >>>